


Listen to the article
A 22-year-old man named Racheal Clayton works two jobs in a Sydney suburb. She works as a personal trainer part-time in addition to her full-time job in public relations. She can’t afford to move out and has given up on the idea of purchasing a house in a reasonable amount of time, so she lives with her parents. In early 2025, she told Al Jazeera, “I am very privileged to still live at home.” “If I take a little bit of a break from my part-time job, I find myself struggling.”
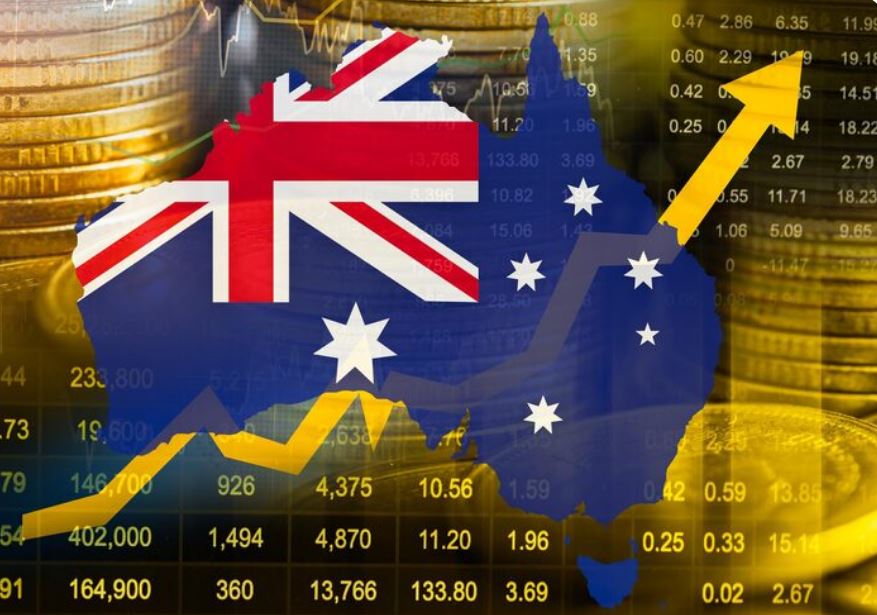
It has been more than 32 years since Australia experienced an official recession. That exceeds the Netherlands’ 26-year run from 1982 to 2008, making it the longest continuous period of any modern economy in recorded history. However, Racheal Clayton’s experience—working several jobs, witnessing real wages decline, and giving up on the dream of owning a home—does not feel like the economic miracle that it is sometimes referred to as. There has never been a greater disparity between the headline figure and actual life, which begs the question, “Is the streak still the right thing to be measuring?”
A recession is officially defined as two quarters in a row of negative GDP growth. By that measure, Australia has been growing steadily since the September quarter of 1991, when it came out of its worst recession since the Great Depression. In retrospect, Treasurer Paul Keating’s famous description of it as “the recession we had to have” captures both the suffering and the subsequent productive clearing. During the deregulated 1980s, banks sold off bad loans they had accumulated. Fiscal measures were implemented by the government. Then, somewhat out of the blue, China appeared.
| Topic | Details |
|---|---|
| Country | Australia — population ~26 million; GDP ~$1.7 trillion USD |
| Last Recession (Official) | September 1990 to September 1991; GDP fell 1.7%, unemployment rose to 10.8%, employment fell 3.4% |
| Length of Streak | Over 32 years and counting as of 2024 — longest recession-free streak in modern economic history (surpassing Netherlands’ 26-year run, 1982–2008) |
| GDP Growth (2024, First 3 Quarters) | Just 0.8% year-on-year — slowest since early 1990s excluding COVID-19 |
| Per Capita Reality | Negative per capita GDP growth for 7 consecutive quarters as of early 2025 — technically a “per capita recession” by some measures |
| Key 2008 GFC Factors | China stimulus (largest fiscal stimulus in history at time); Australian banks avoided risky lending post-1990s; AUD $42 billion government stimulus package |
| Cash Handouts (2008–09) | AUD $900 per person for those earning under AUD $100,000; AUD $950 for families with school-age children; $14.7B for school construction |
| Real Wages (2025) | 4.8% below pre-pandemic levels per OECD data — worst in OECD; average OECD real wages rose 1.5% over same period |
| Philosophy Behind 2008 Response | Treasury Secretary Ken Henry: “Go hard, go early, go to households” |
The importance of China’s development trajectory to Australia’s economic narrative over the next three decades cannot be overstated. Australia was the closest significant exporter of coal and iron ore as China entered a phase of infrastructure-led growth. According to Jeff Borland, an economist at the University of Melbourne who specializes in Australian economic history, the mining boom that followed “will probably never be seen again.” Fly-in, fly-out workers and job sites abound in rural Western Australia. The GDP figures increased. While most other developed economies could only observe from a distance, the reserve bank enjoyed the luxury of a commodity-fueled buffer.
The streak was put to the test during the global financial crisis of 2008, and Australia passed thanks in large part to a combination of policy speed and good fortune. China was fortunate. Fearing a recession of its own, Beijing’s government injected what was then the biggest fiscal stimulus in history into the country’s economy, maintaining construction activity and the demand for Australian materials at a time when international markets were collapsing. Australian banks, still damaged by the collapse of Westpac in the 1990s, had refrained from the reckless lending practices that brought down American and European banks. Additionally, the Rudd administration moved quickly, sending out AUD $42 billion in handouts, including $14.7 billion in school construction grants and $900 checks to working Australians. Ken Henry, the Treasury Secretary, famously summed up his philosophy as “Go hard, go early, go to households.” It was successful. Spending by consumers increased prior to the onset of a recession.
The Federal Reserve Bank of St. Louis clarified in 2019 that Australia has experienced several downturns since 1991 when looking at GDP per capita rather than total GDP. This is an honest account of the country’s 32-year streak. Even though output per person was declining, population growth, primarily due to continued immigration, kept the overall GDP positive. The majority of developed economies exhibit a similar divergence, so Australia is not alone. However, it is important to consider whether Australians have been becoming wealthier or just more numerous. Australia had experienced negative per capita GDP growth for seven quarters in a row by the beginning of 2025. The term “per capita recession,” which some economists have begun to use, captures something that the headline figure does not.
The structural end of the forces supporting the streak is also facing it. The demand for Australian coal and iron ore has decreased because China’s economy has shifted away from building and infrastructure. While the OECD average moved 1.5% in the opposite direction during the same period, real wages in Australia are still 4.8% below their pre-pandemic levels. The affordability of housing has reached a point where it is restricting both generational wealth accumulation and labor mobility. Additionally, GDP growth in 2024 was only 0.8% year over year, which is much more in line with the early 1990s before the streak started than it is with the commodity boom years.
Western Australia, which was most exposed to the mining cycle and has endured its own localized pressures for years, has not fared as well as the eastern states of New South Wales, Victoria, and Queensland. Even so, this difference indicates structural diversity in the country’s economy. The total output is still increased by immigration. The Reserve Bank of Australia still has resources that it hasn’t used to their full potential.
Observing Australia during this time gives the impression that the streak has been a true accomplishment, not only due to geography and commodity luck but also to swift and wise policy decisions made at pivotal points in 1991, 2008, and other junctures. In his 2008 reflection, Borland was cautious to admit that even those who profited from China’s rise were “surprised by the scale.” An economy that is resilient to shocks is not merely fortunate. However, a 32-year track record does not automatically provide an answer to the question of whether it can survive this moment, which includes slower growth, compressed real wages, exhausted housing markets, and a China relationship that generates significantly less tailwind than it once did.
The run is still going strong. The part that needs the most attention at the moment is whether it persists due to population math, true resilience, or just the lack of a strong enough shock.


